Kaggle See Click Fix competition postmortem
The data
This challenge was to predict the number of votes, comments, and views that issues created on See Click Fix would get. The provided datasets included the latitude and longitude, summary and description (both text fields), a source (mobile client, API, city-initiated, etc…), a created timestamp, and a category tag. Of course, the training dataset included the three items to be predicted.
My approach
In previous competitions, my code has always tended spin out of control as I add more and more steps to extract features from the data. At first it goes smoothly, just data in data out through a series of steps, but, oh wait, I need to preserve the data that came out of this step so I can pass it into the step after this next step, and I’d like to use this model to produce features for another model, and before you know it, I have a crazy kludge that I limp to the end of the competition with, but have no idea how it worked a few months later.
This time, I decided I would make extensive use of scikit-learn’s Pipeline and FeatureUnion classes. Pipeline handles flowing the data through all your steps. You just build them and add them to the pipeline. FeatureUnion lets you build a bunch of feature extractors and use them in unison like one feature extractor. It handles flowing the data through each feature extractor and eventually merges the resulting feature matrices. Where they get really useful is when you composite them. On feature extractor probably involves multiple steps, so you can have a FeatureUnion made up of a bunch of feature extractors, each one being made up of a Pipeline of several steps.
All that I had to do was adhere to the Transformer interface, which just means
instead of having my own for loops or what-have-you, out in the wild, each
step needed to be an object that implemented the methods transform and fit.
Feature extraction
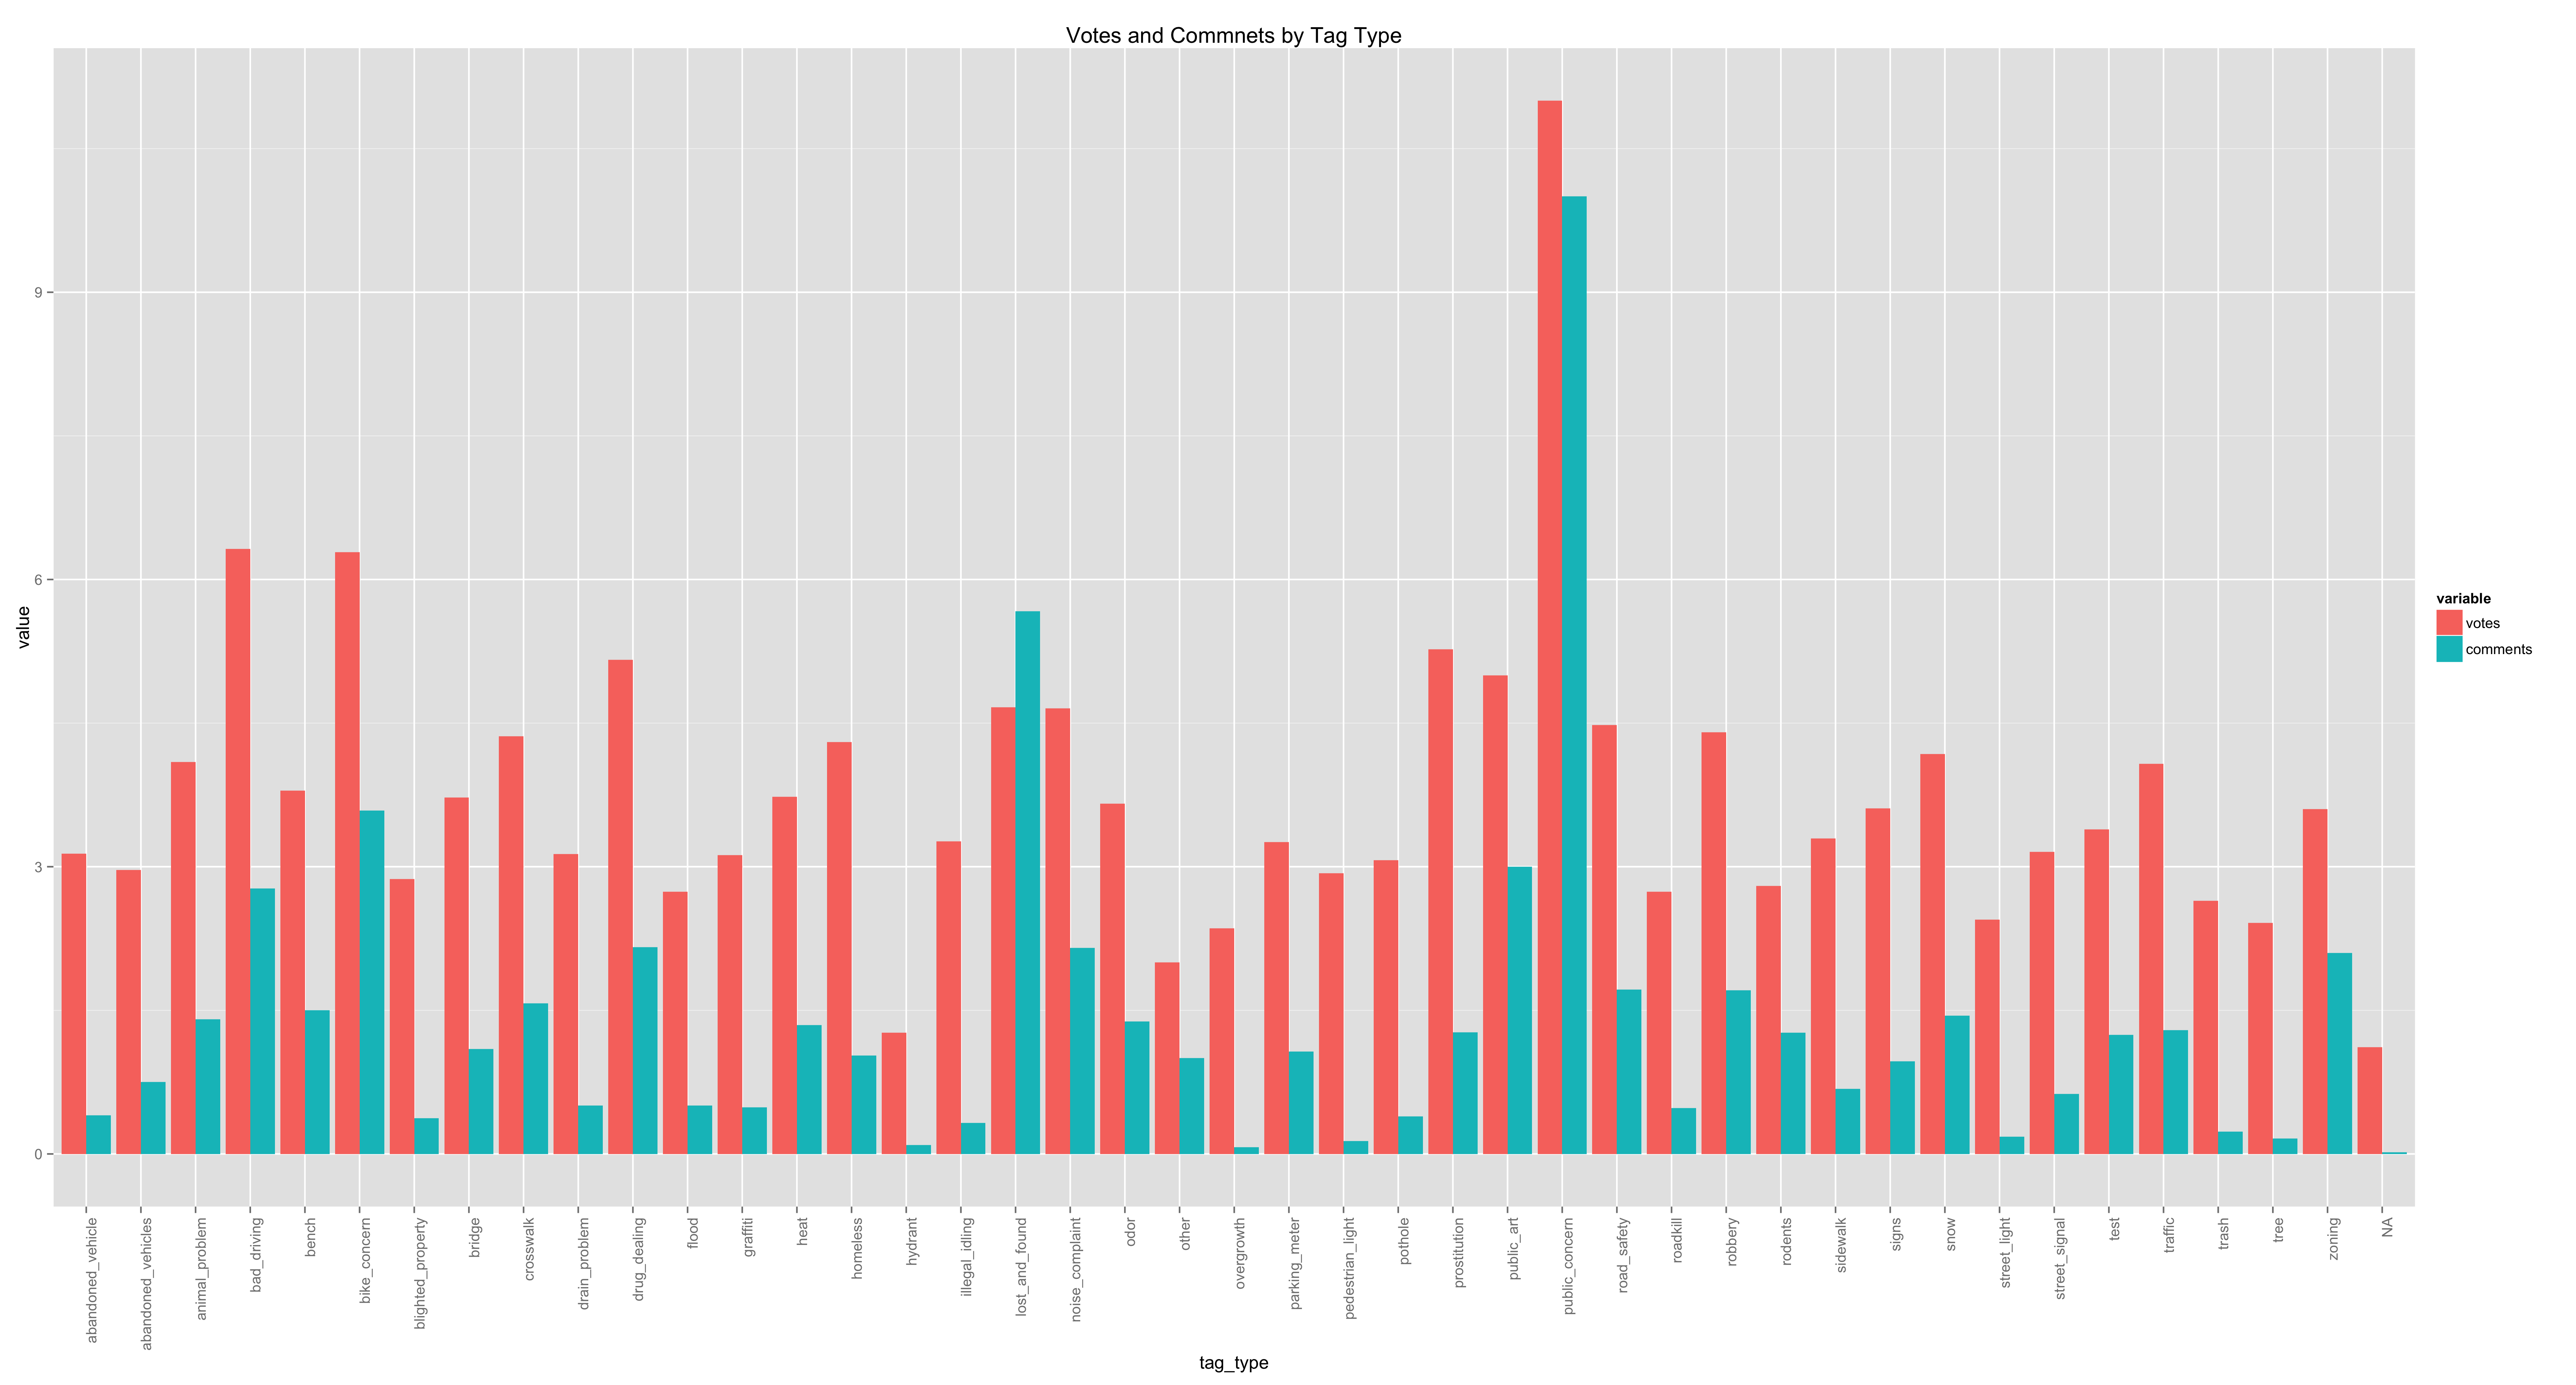
But enough scikit-learn details. My approach, like always, was to start simple. I always try to establish a base submission with the most stupid-simple model I can think of. To that end, my first submission was just the mean by tag_type, the category value in the dataset. This yielded a very low, but better than guessing, score. From there, I started to engineer some features from the data, starting with the aforementioned tag_type and the location latitude and longitudes. The estimator that I used was a SGDRegressor.
Early on, based on tips found in the competition forum, I discoverd that more than any features I had engineered, the biggest boost I got was to scale the values I was trying to predict. Instead of training for the raw votes, comments, and views, I trained on y = log(v+1) where v is the variable to be predicted. Then upon making predictions, I scaled them back up using exp(p)-1 where p is a predicted value.
Eventually my feature set ended up including the tag_type, source, description length, description (1-3)-grams, summary (1-3)-grams, and a discrete location. Each example came from one of four cities, so just using the continuous values probably wouldn’t tell much. Intuition says issues closer to the city-center are more likely to get attention, but that intuition isn’t getting used in raw in lat+lon pairs from four corners of the country! To squeeze some useful information from these numbers, I transformed them to discrete locations using a k-nearest neighbors model wrapped in a transformer class. In hindsight, this was completely unnecessary and I could have just written some simple greater-than/less-than rules, but it worked. I had tried other features along the way, like months since created, but ended up dropping several because they hurt my score.
Estimator
Out of ideas for features, I turned to estimator tuning. I didn’t get a lot out
of using a grid search to tune the SGDRegressor’s hyperparameters. In the end, I
just left them at defaults, except for shuffle = 1. I also tried a couple
other models. My reason for going with the SGDRegressor was validated pretty
quickly. Both the PassiveAggressiveRegressor and an SVR were very slow for such
a large training set. Neither cross validated higher than the SGDRegressor, but
I included the SVR’s predictions in my final submission with hopes that it
would complement the SGDRegressor’s predictions and produce some net accuracy.
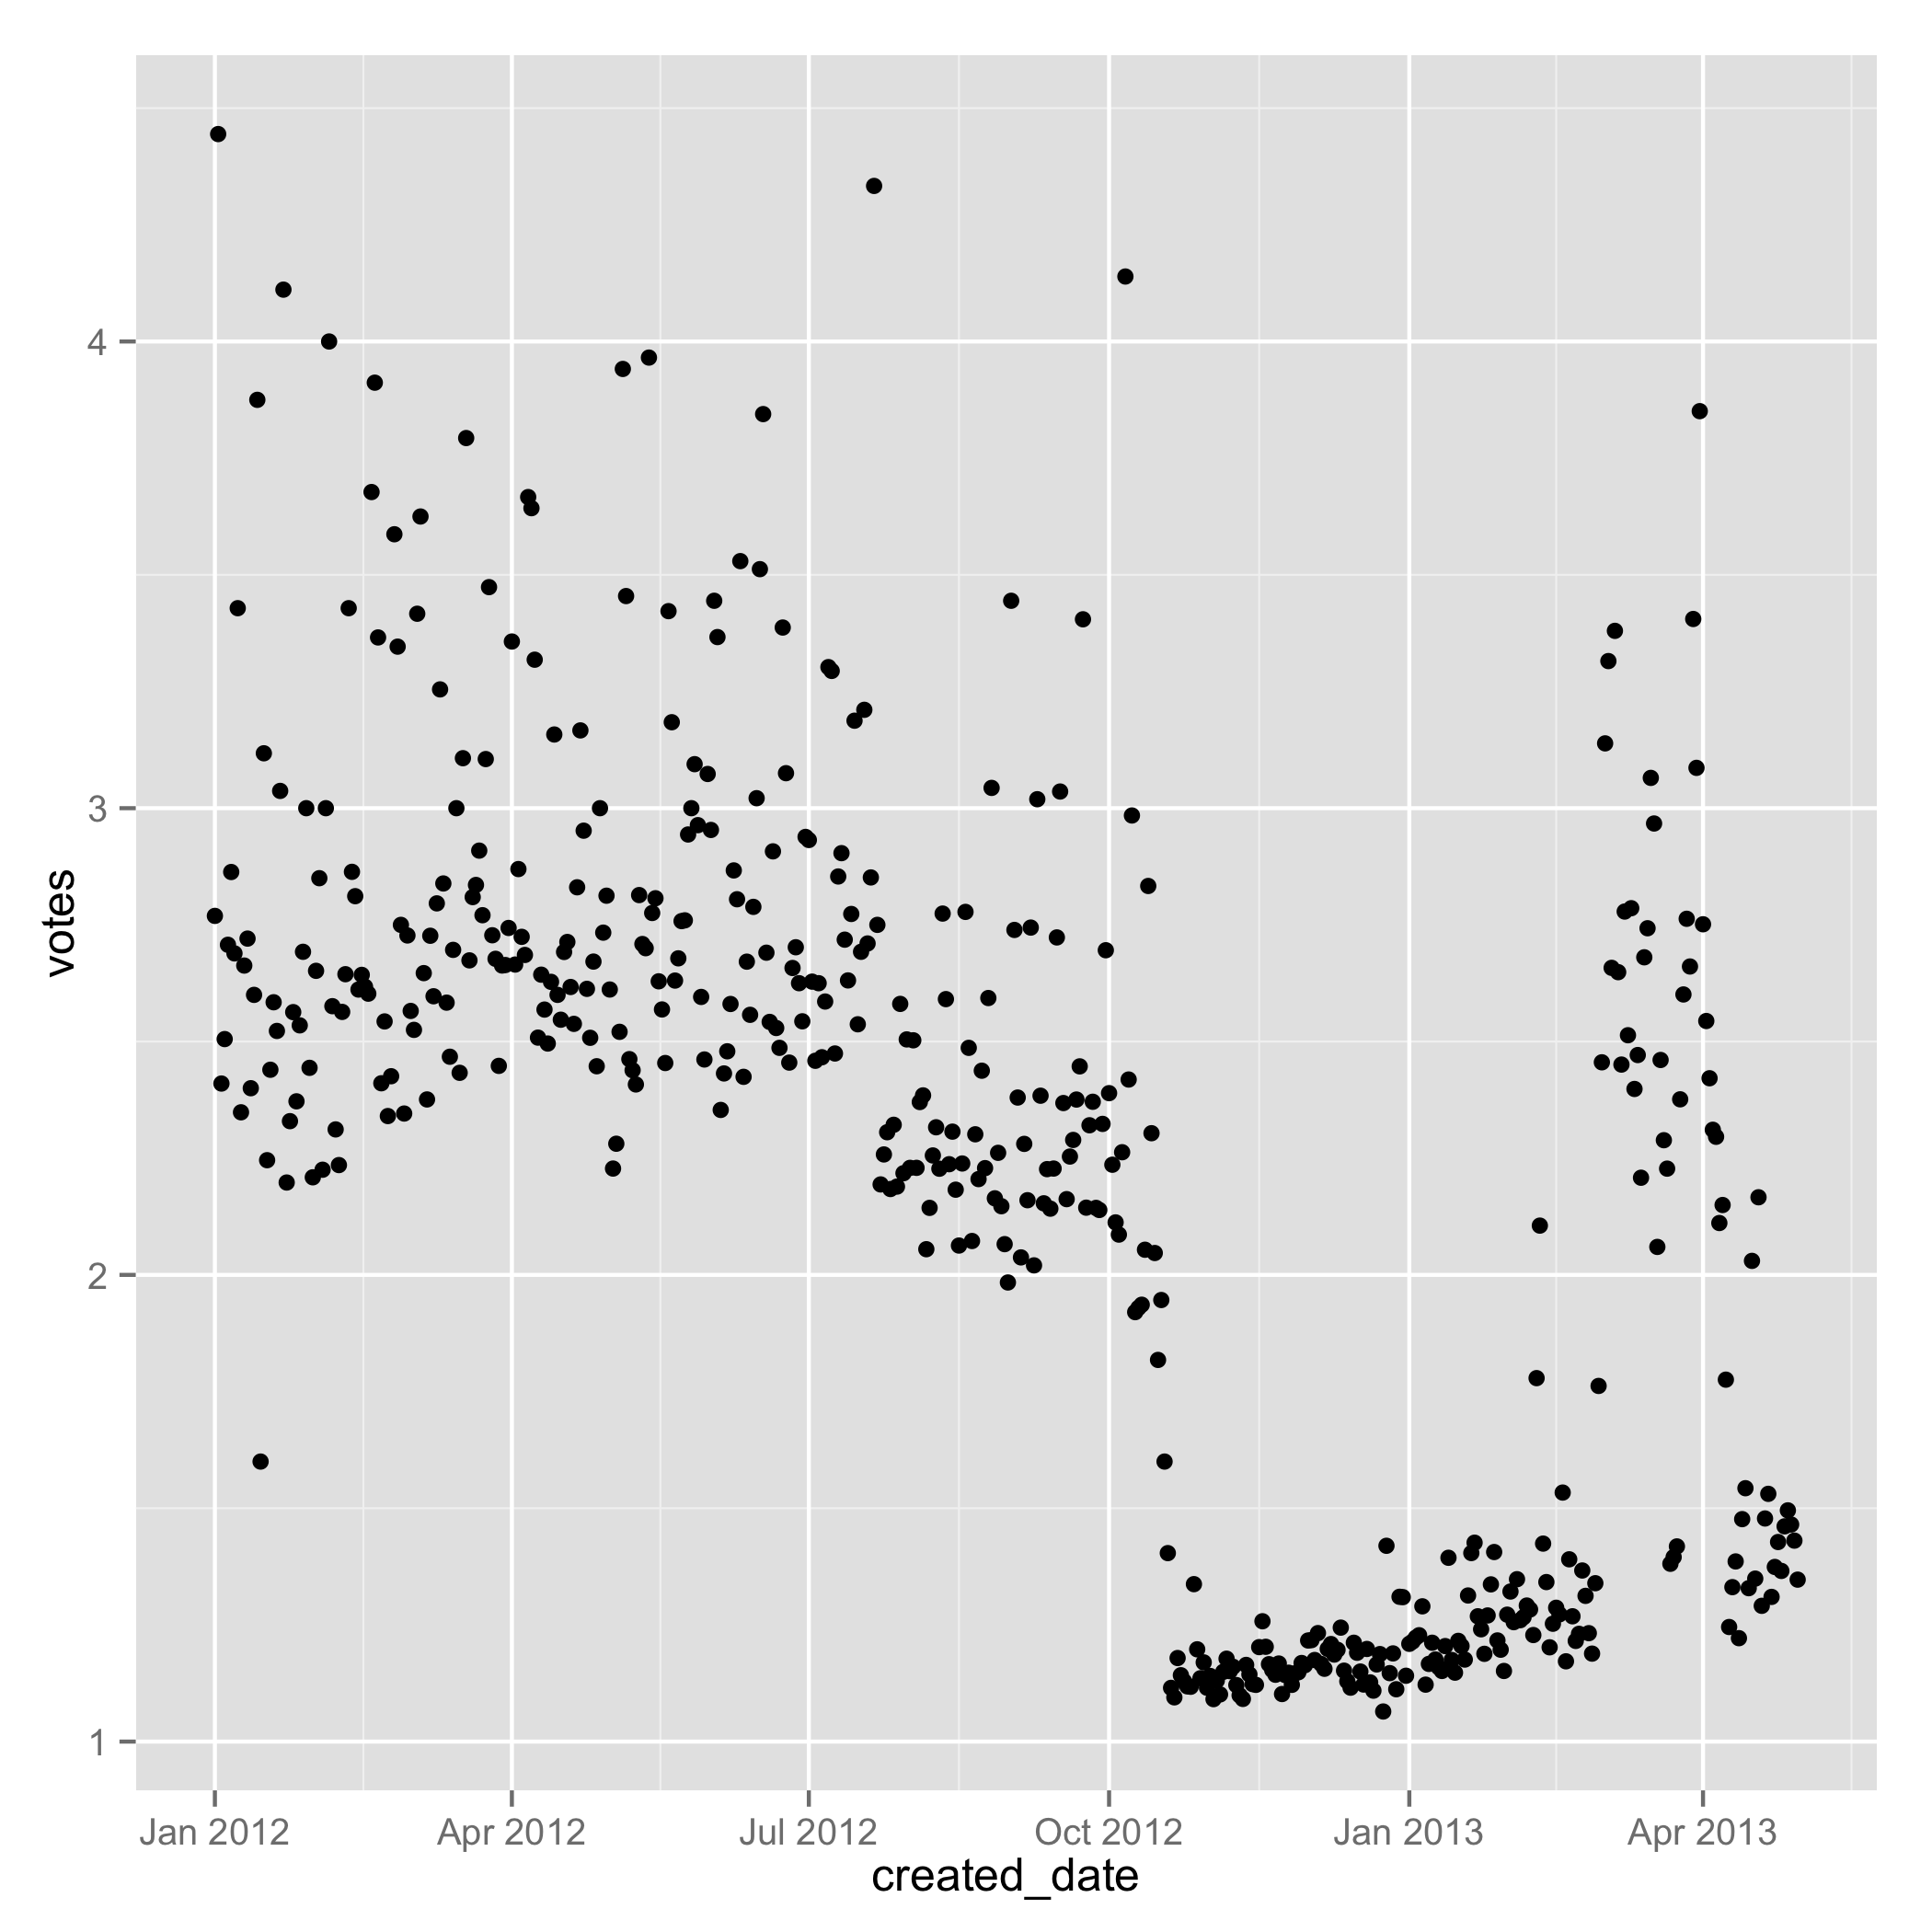
One last gain came from ditching the first 10 months of training data. Seriously, just throwing data away. Not sure what went on at See Click Fix, but there were some crazy highs and lows in their traffic. I tried scaling the target values by the number of months since created, and that didn’t help at all, so in the end, I just axed a large portion of the training set.
Outcome
I ended up scoring 147/533 on the public leaderboard and 151/533 on the private leaderboard. While this isn’t a great score, I feel happy to be in the top 70%. Furthermore, I didn’t drop very far from the public to private leaderboards, which means I didn’t horribly overfit. It’s always interesting to see people doing really well during the competition who then drop significantly on the private leaderboard.
The code is up on GitHub under MIT license. Feel free to learn from it or use it as you see fit. Lastly, I’ve worked solo on every Kaggle competition I’ve done, but I’d like to work on a team. If you’re looking for someone to work with, I’d love to hear from you!